Main Campus Natural Gas [MMscf]
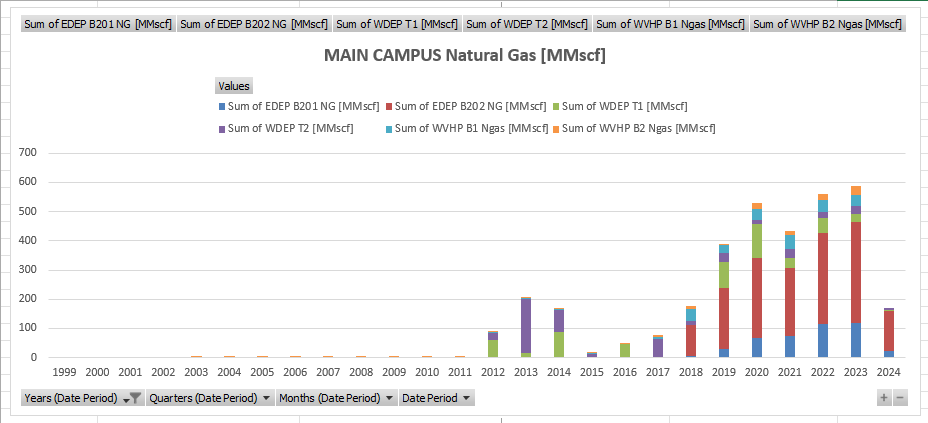
The data presented in the image offers a detailed, historical overview of natural gas consumption for various facilities, denoted by the acronyms EDEP, WDEP, and WVHP. Spanning several years from 1999 to 2024, the information is meticulously organized in a monthly format, indicating the end dates of each month, which suggests the records are maintained on a monthly basis. This long-term dataset is comprehensive, potentially serving multiple analytical and operational needs, such as tracking energy expenditures, assessing environmental impacts, and managing facility operations.
Columns are dedicated to specific boilers or turbines within the three departments, with each department’s natural gas usage broken down into individual components and then aggregated into a total. For example, EDEP’s consumption is separated into B201 and B202 boilers, followed by a total for EDEP boilers, while WDEP and WVHP have similar breakdowns for their respective units. This level of detail in segmentation allows for precise monitoring and analysis of each unit’s gas usage.
Initially, the dataset starts with zero consumption across all entries, which could represent the baseline from which all future consumption is compared, or perhaps the onset of systematic record-keeping. As time progresses, these figures change, reflecting the operational consumption of natural gas. The variance in consumption could be attributed to factors such as seasonal demand, changes in operational intensity, facility expansions, or improvements in efficiency.
The inclusion of year, month, and a concatenated year-month column provides an additional temporal dimension to the dataset. This design facilitates time-based analyses, allowing for a multi-layered review of consumption patterns. Analysts could leverage this structure to conduct various temporal analyses, including but not limited to seasonality assessment, year-over-year comparisons, and identifying long-term trends or shifts in consumption patterns.
Given the energy-intensive nature of the operations suggested by the data, the recorded information is likely crucial for several business and operational functions. Financial departments could use this data for budgeting, forecasting, and cost analysis. Environmental teams might review the data for sustainability reporting, carbon footprint calculations, and compliance with environmental regulations. Operational managers could assess the efficiency of boilers and turbines, plan maintenance schedules, or strategize upgrades to more energy-efficient models.
Fluctuations in the data across different months and years could reveal critical insights. For example, a sudden increase in usage may correlate with an expansion or an added workload. Conversely, a decrease may indicate energy-saving initiatives, equipment upgrades, or a reduction in operational demand. Periods of consistent increase across multiple facilities might suggest organizational growth, whereas a downward trend could point to industry-wide shifts toward renewable sources or energy conservation measures.
The dataset may also serve as a foundation for predictive analytics. Using historical consumption data, predictive models could forecast future natural gas needs, informing purchase strategies and risk management, especially in the volatile energy market.
In essence, the dataset is not merely a record of numbers—it tells a story of organizational behavior, energy management, and potentially the evolving landscape of industrial energy utilization. The data, stretching over two decades, is a rich repository for anyone interested in operational history, energy management, and the financial or environmental implications of energy consumption within large-scale facilities.


![EDEP B201 NGas [MMscf]](https://unidash.net/wp-content/uploads/edep-fuel-b201-mmscf-daily-cems-20230228-768x663.png)